

From data to profitable digital services: a map to keep you on track
Like many OEMs, you have connected your products and are collecting data to offer digital services to your customers or to improve the efficiency of your service teams within their maintenance contracts. You may now be wondering if you are getting all the benefits you can and how to evolve your solution to get more.
The initiatives you have started are part of a broader journey. Digital servitization means moving from selling products to selling products+services supported by digital technologies. This process is often more complex than expected. It involves several areas of your company and requires progressively transforming your business model. Therefore, introducing a single technological innovation is not enough to ensure success. You need a comprehensive understanding of all the opportunities and obstacles you may encounter.
A Map to guide you on your Digital Servitization journey
For all these reasons, we decided to create a map. As on any journey, a map allows you to:
- know where you are on the path;
- check whether you are moving in the right direction based on your goals;
- understand if you are using the best means to reach your goals;
- have a guide to help you decide which direction to take in the future.
Our Digital Servitization Map is built on experience and collaboration
We began working on the map when we realized the close link between the success of our DPS system and a solid, clear digital servitization strategy.
To develop the map, we combined our experience in digitalization, which we gained by analyzing over 300 cases across customers and prospects, with the knowledge of two leading research centers on servitization with which we continue to collaborate: Advanced Services Group and ASAP.
The two dimensions of the map: servitization and digitalization
Starting from these two aspects, servitization and digitalization, we built the two axes of the map:
- Y axis: the value proposition you want to offer your customers, inspired by the Service Ladder of Advanced Services Group;
- X axis: the role that digitalization plays (generating information, supporting your end customers, supporting after-sales operations, monetizing).
These two dimensions create a grid. Each intersection represents an offer of digital services and the digital capabilities needed to successfully deliver them.
Two examples:
- at the intersection of Repair and Supporting service teams, your solution must make your service team more efficient through remote diagnostics based on telemetry data or augmented reality tools;
- at the intersection of Performance and Generating information, your solution must process product and telemetry data to provide insights on uptime, overall equipment effectiveness (OEE), energy efficiency, production rate, etc.
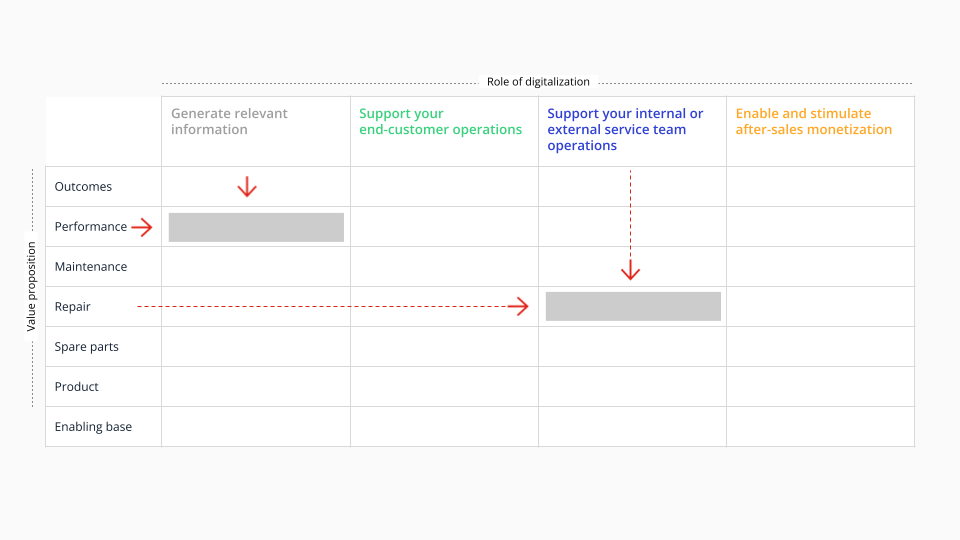
Each intersection requires a specific solution to be completed successfully and deliver tangible results, such as lower costs or new revenue. These results grow in value over time, as you combine more elements.
And there's more.
You don't get just a blank grid. We already identified and traced proven segments you can compose to build your digital service offering and plan your digital servitization pathway.
.png)
And you? Do you know where you are on your Digital Servitization journey? Do you have the right tools to capture all the benefits? Which elements do you need to reach your destination?
Now you can use our map, too. Go to our Learning Center.
-2.png)


